Echoview automatically counts and measures fish using imaging sonar data
With Echoview, you can automatically count, measure, and track fish (and other aquatic species) using imaging sonar data recorded by systems such as Sound Metrics ARIS, Blueprint Subsea Oculus, Teledyne BlueView, or Tritech Gemini. The result is faster and more consistent analyses with powerful visualizations.
Why is imaging sonar useful?
Imaging sonars, also known as forward-looking sonars or acoustic cameras, are specialized multibeam echosounders that are increasingly popular in freshwater, estuarine, and marine science. Deployed from mobile or stationary platforms, they provide non-invasive, real-time views of aquatic life, even in low-visibility environments, allowing researchers to track organism movement and behavior as it happens. The data gathered can support applications such as migrating salmon counts, fish passage monitoring, obstacle avoidance, and broader studies of aquatic species movement, habitat use, and biodiversity.
While imaging sonar is a powerful tool, the manual post-processing of collected data remains a major limitation. Analysts often spend hours reviewing acoustic imagery, visually identifying and counting each fish as it passes through the beam. This involves the human eye identifying shape, position, and behavioral traits of targets. The process is time-consuming and demands intense mental focus, making it prone to errors that can vary from person to person. To overcome these challenges, users are turning to computer-automated methods to streamline analysis, improve consistency, and deliver more objective results.
Why Echoview for imaging sonar?
Echoview is internationally recognized as the industry standard software for advanced hydroacoustic data visualization and analysis in aquatic environments. Trusted by researchers and professionals in over 70 countries, it provides a robust platform for transforming sonar data into actionable, reliable results.
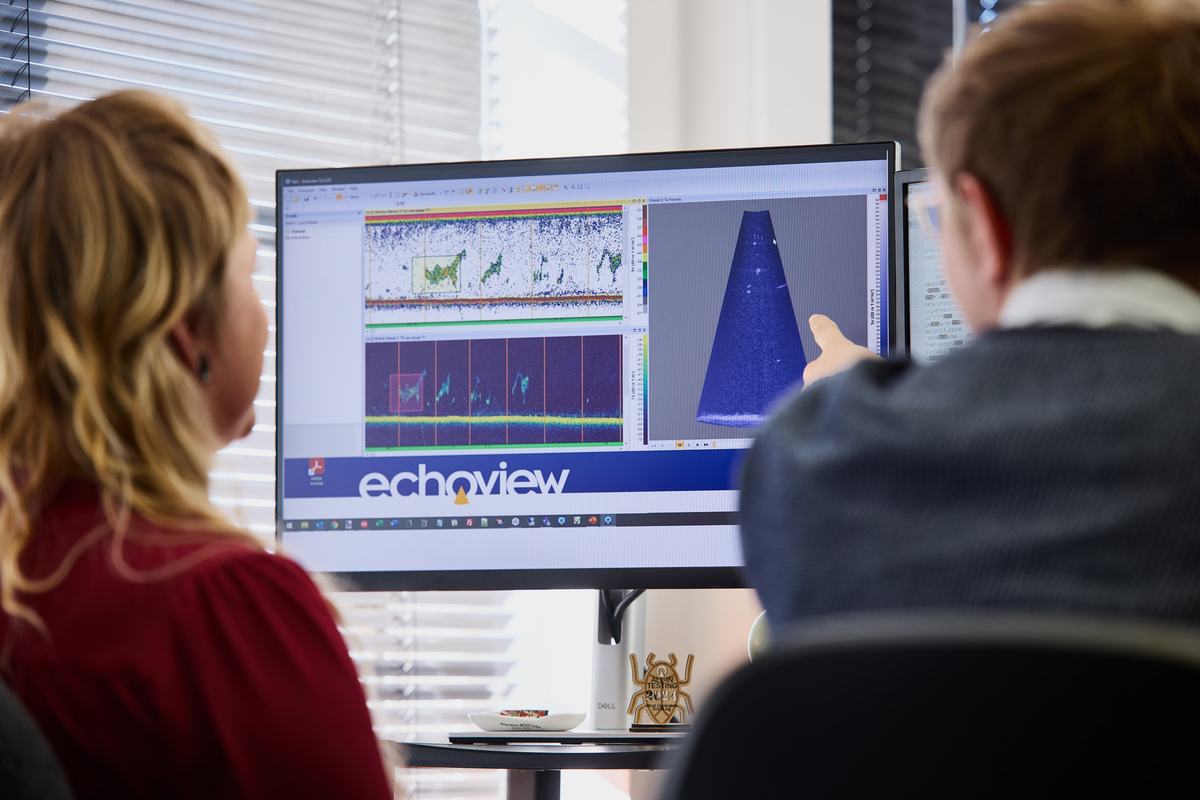
Echoview is compatible with data from a wide range of imaging sonars (and other echosounders), including Sound Metrics ARIS and DIDSON, Blueprint Subsea Oculus, Teledyne BlueView, Kongsberg M3 and Flexview, and Tritech Gemini. For a full list of hardware that Echoview supports, please click here.
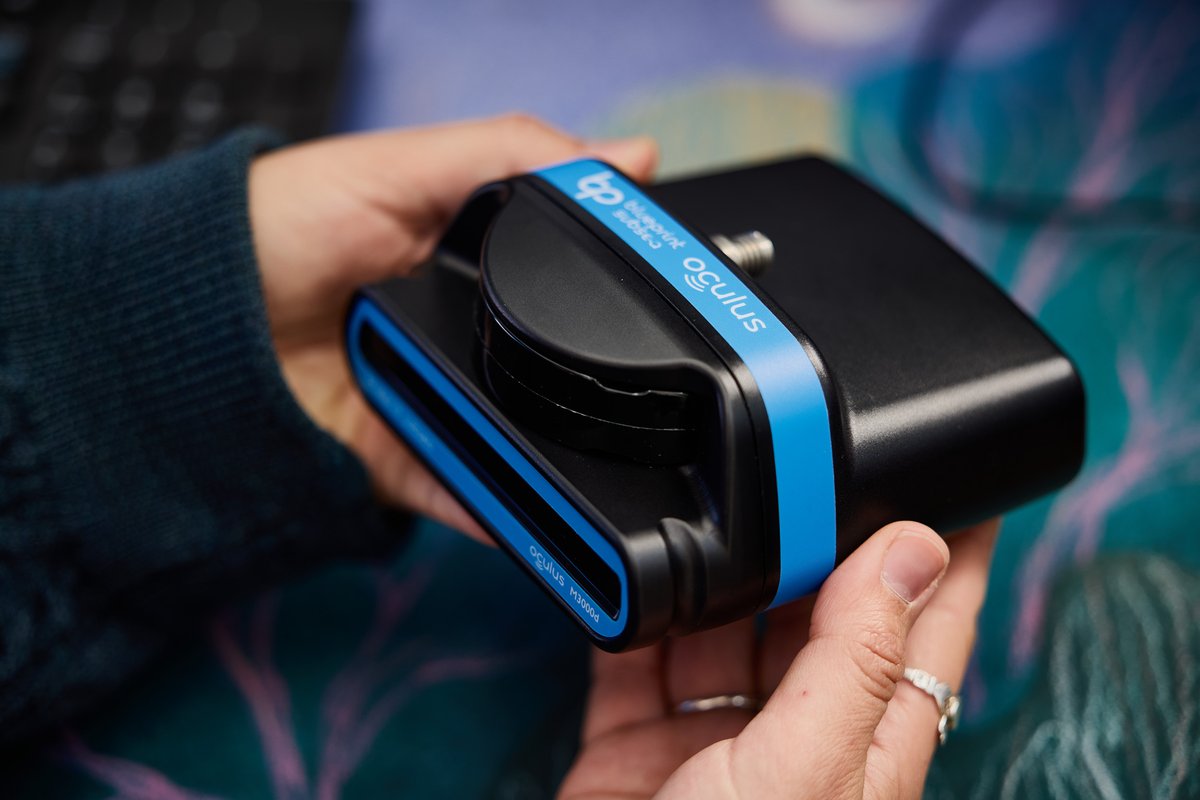
With a suite of sophisticated analysis features, Echoview enables users to perform comprehensive and detailed assessments of imaging sonar data, from automated detection and measurement through to repeatable reporting and visual review.
Key benefits include:
- Processing small to large datasets quickly and efficiently
- Detecting details that the eye may miss
- Automating routine analysis tasks
- Delivering objective, repeatable results
- Improving data consistency
- Reducing human error through built-in quality control
- Saving time across every stage of analysis
- Creating clear, informative visual representations of sonar data
- Supporting confident, data-driven decision-making
- Generating professional, customizable reports
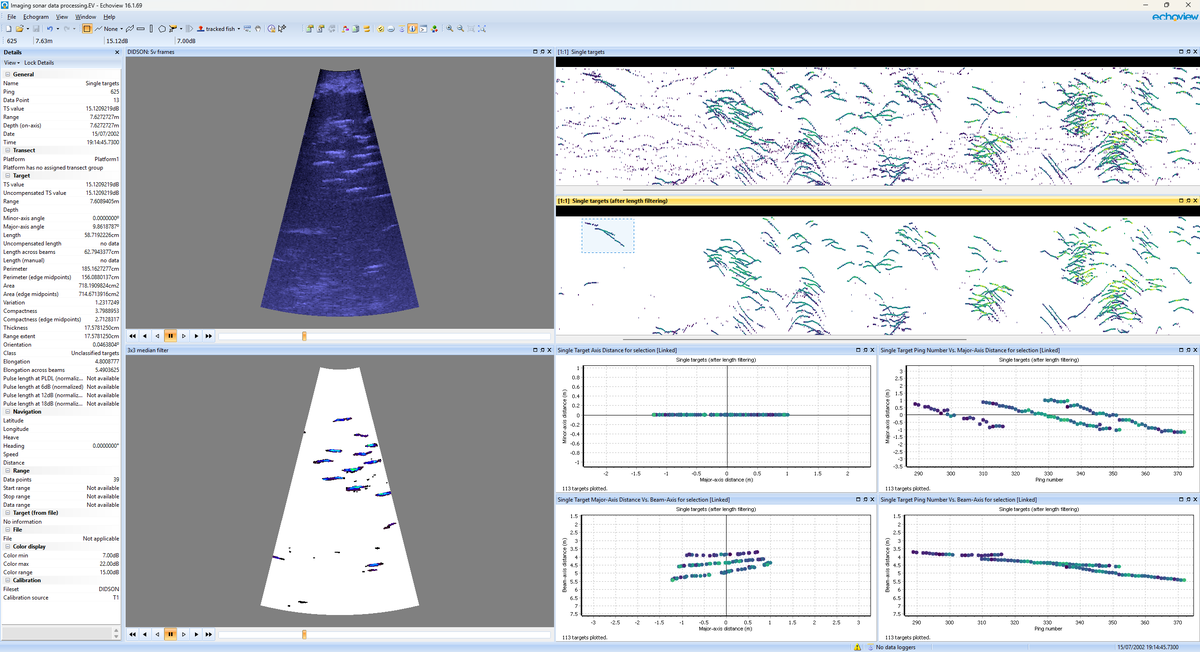
Echograms, algorithms, and graphs within Echoview enable you to detect and visualize fish and other targets.
What can Echoview do?
Explore | Interpret | Analyze | Report
Echoview is the solution for researchers who need to process complex sonar files and turn them into actionable insights through:
Comprehensive detection, tracking, and measurement
Automatically detect and track fish and other aquatic species to estimate counts, size, behavioral metrics, and other key measures:
- Detect targets and characterize them with useful properties such as length, thickness, area, perimeter, elongation, compactness, and more
- Filter target detections by any property
- Run customizable tracking algorithms for individual or aggregated targets
- Gather behavioral insights, including movement direction, speed, track tortuosity, and more
- Produce repeatable, high-quality quantitative results
Flexible data preparation and cleaning
Refine your data with precision and control:
- Custom data processing workflows
- Many built-in tools for data cleaning and enhancing features of interest, including image smoothing, background removal, noise filtering, and more
- Ability to incorporate your own custom processing techniques via Python
Transparent and examinable processing
Visualize, explore, and verify your data at every stage of processing and analysis:
- View full details of raw data
- Generate visuals including graphs, 3D or 4D displays, and 2D echograms
- Color detected targets by length, area, intensity, and many other properties
- Synchronize multiple replay windows and echogram displays
- Report and share results
Automated processing for efficiency
Streamline workflows and accelerate results:
- Perform template-based project automation to reduce manual effort
- Generate target detections and fish tracks automatically for rapid verification and export
- Batch-process multiple files for consistent results across large datasets
Renowned quality, support, and documentation
Echoview is built on over three decades of scientific rigor, supported by experienced development and quality assurance teams, and trusted by a global community of users. Its widespread use in research, including frequent citations in scientific publications, reflects its reliability, transparency, and continued importance in hydroacoustic analyses.
Users can work confidently with a robust, rigorously tested platform, comprehensive documentation through the Help File, resources in the Learning Hub, and access to Maintenance and Technical Support from our knowledgeable science team to support confident publication of results.
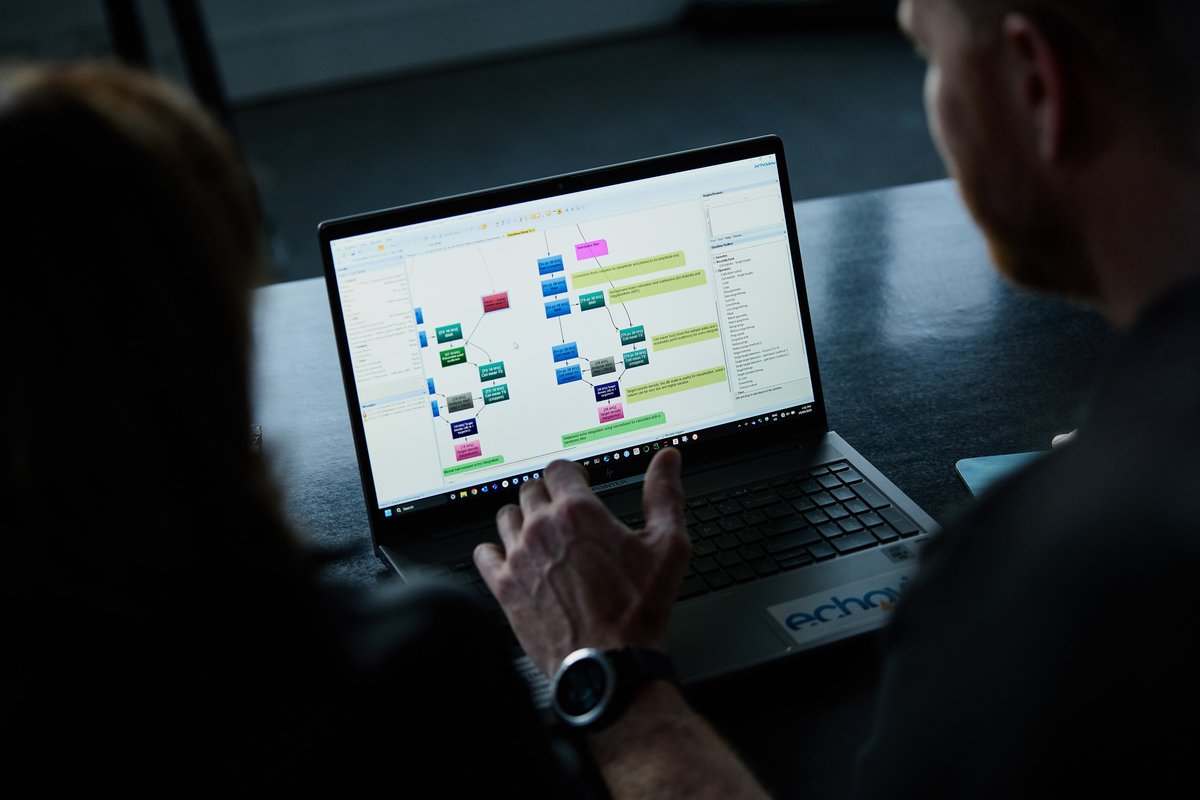
Examples of fish counting in Echoview
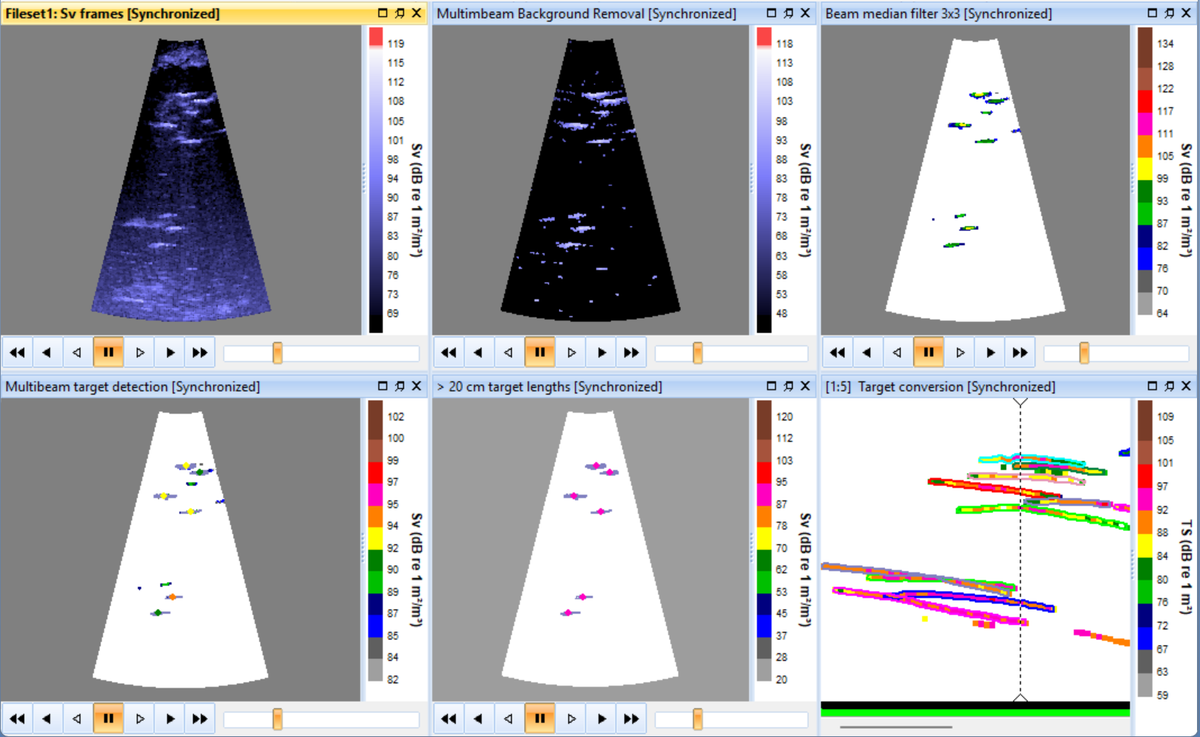
This Sound Metrics DIDSON example shows how Echoview can be used to extract, filter, and track fish observed with imaging sonar. Targets detected in each frame (ping) can be filtered based on size, shape, and backscatter properties, and tracked over time. The workflow demonstrates how Echoview can visualize and clean the data, detect and characterize targets, and track fish.
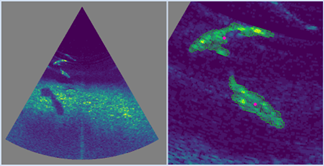
This Blueprint Subsea Oculus example shows Echoview makes it easy to view and replay raw Oculus pings, as shown in the left panel, and provides a variety of built-in algorithms that enable you to clean data and detect targets such as fish, as shown in the right panel.
What’s the evidence?
Discover how Echoview is applied in real-world research and learn from case studies, published papers, and tutorials that showcase automated fish counting and behavioral analysis using imaging sonars.
Echoview case studies
- Counting, sizing and tracking Chinook Salmon in the Kenai River Alaska
- Processing data from acoustic cameras to evaluate fish behavior
Key published papers
- Applications and analytical approaches using imaging sonar for quantifying behavioral interactions among aquatic organisms and their environment
- Improved Fish Counting Method Accurately Quantifies High-Density Fish Movement in Dual-Frequency Identification Sonar Data Files from a Coastal Wetland Environment
- Observer bias and subsampling efficiencies for estimating the number of migrating fish in rivers using Dual-frequency Identification Sonar (DIDSON)
Tutorials
Visit our tutorial page for step-by-step guides on:
- Introduction to fish tracking
- Introduction to multibeam target data processing
Contact us for a demonstration
Want to see how many fish are hidden in your imaging sonar data? Share a sample dataset with our science team and we'll demonstrate an Echoview workflow using your data. Even if you don’t have data yet, we can provide examples that show how Echoview can be applied across different research and industry contexts. As experts in hydroacoustic science, we also offer specialized training and consulting services. Whether your project is small or large, we’re here to help.
Email us to learn more: info@echoview.com