Echoview 16 is out now
Visual | Dynamic | Precise
We're pleased to announce the release of Echoview 16, a major update that makes it easier than ever to go from raw echosounder data to meaningful results and actionable insights that you can trust.
This release introduces powerful new features designed to help you gain more insight from your active acoustic data, and reflects our continued commitment to delivering high-quality data processing solutions.
Echoview 16 is available to all license holders with a current Maintenance and Technical Support (MATS) plan, subscription, or lease.
To discuss your options for accessing the latest version, please contact info@echoview.com.
To view the webinar on our latest release, please visit here.
Support for Humminbird and other new formats
Echoview 16 broadens compatibility with a range of echosounder and sonar systems, ensuring you can work with more instruments and more datasets in a single environment:
- Support for *.dat and *.son files recorded by Humminbird fish finders, including the 900/1100 series, Helix, Solix, and Apex models.
- Reading of pulse duration included in Lowrance *.sl2 and *.sl3 files, improving the accuracy of your results.
- Ability to apply depth-dependent sound speed corrections (e.g. from CTD casts) directly to Nortek echograms for more precise analyses.
- Support for Echoview-defined *.table.csv files containing time series data, opening up new ways to explore your acoustic data alongside any type of related measurements.
- Better identification and naming of individual variables via Source Names in exported or third-party generated *.evd files.
Conversion to ICES SONAR-netCDF4 format
Echoview can convert single-beam Sv, TS, angular position, GPS, and heading data into *.nc files that conform with the ICES SONAR-netCDF4 standard (version 2, type 5 equations), making it easier to share your results with collaborators, archive them in a standard format, or integrate them with third-party analysis tools. Exports can be automated using new COM methods (ExportICESSONARNetCDF4 and ExportICESSONARNetCDF4All).
The resulting files can also be loaded back into Echoview for further processing.
Wideband echointegration
Echoview 16 introduces new wideband echointegration analysis variables for Kongsberg EK80 data, supporting direct comparison of wideband abundance and biomass estimates with traditional narrowband echointegration. The new variables are:
- Sv_f_mean
- ABC_f
- NASC_f
Bubble plots and other alongtrack displays
Introducing bubble plots, sometimes known as bubble charts or proportional symbol maps. These let you spatially map key metrics through a more dynamic and intuitive update to our traditional alongtrack displays. By representing values such as NASC or fish density as bubbles on the map, you can quickly see patterns and trends that might be lost in raw numbers, making it an ideal tool for presentations or communicating results to stakeholders.
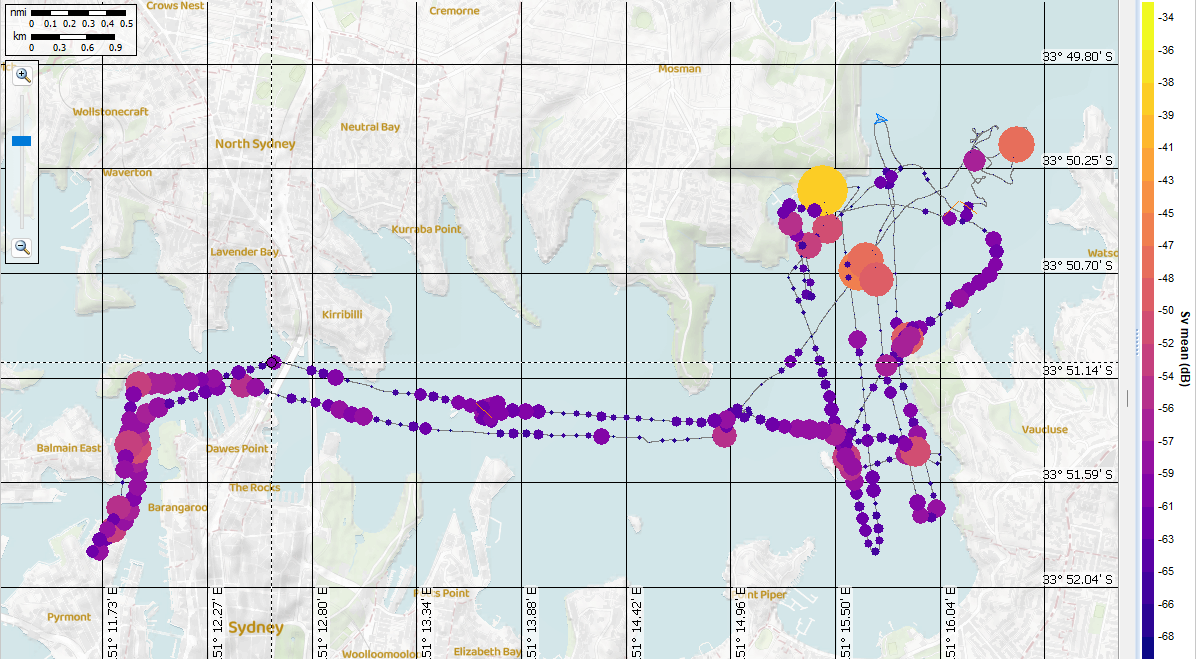
In this example, bubbles are colored and sized based on water column Sv mean in 100 m intervals. This provides a clear spatial overview and also highlights outliers, such as the large yellow bubble that reveals bottom signal mistakenly included in water column data.
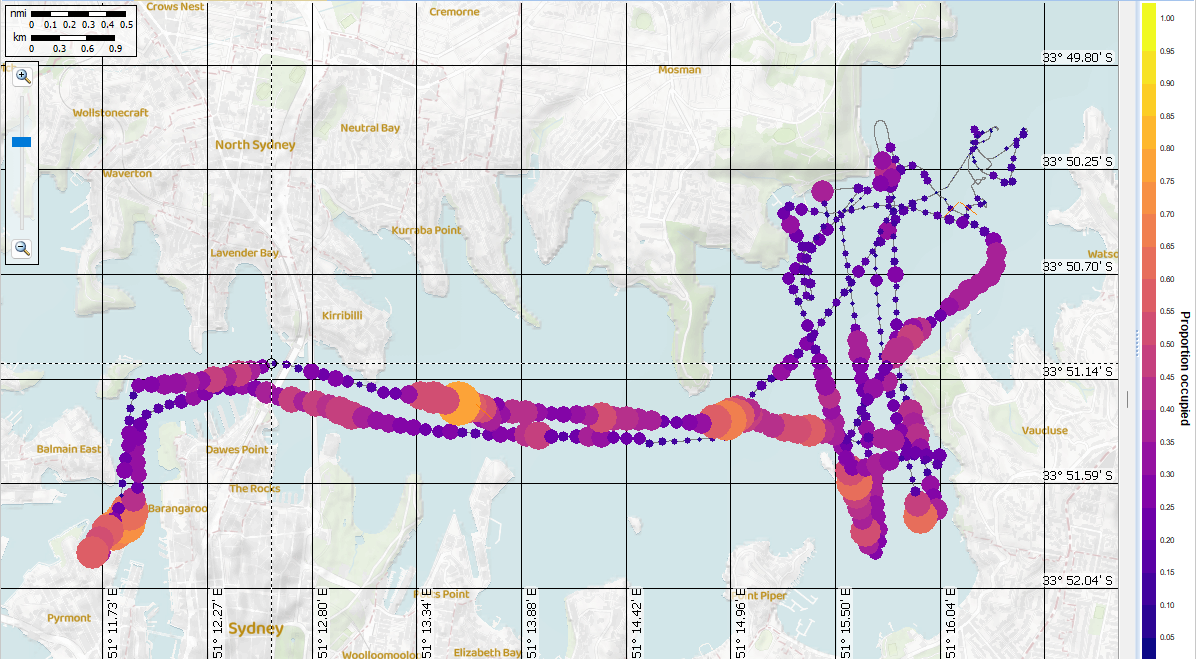
Bubbles in this image represent the proportion of the water column occupied by above-threshold data, providing interesting additional context to the same data in the previous image.
Bubbles or lines can be shown in the alongtrack window, and a range of options make the display highly customizable. Alongtrack data values are reported in the Details window and information toolbar on mouseover.
Mapping and time sliders
New time sliders in cruise tracks and alongtrack displays let you focus on specific transects or time periods, making it easier to review overlapping track lines or isolate the exact section of a survey where interesting events occurred.
Echoview 16 also adds support for Web Map Tile Service (WMTS) maps, enabling you to display detailed, fast-loading background maps from online or custom servers directly within your cruise tracks or alongtrack displays. This provides higher-resolution context for your survey data, helping you to visually connect hydroacoustic surveys with their real-world locations.
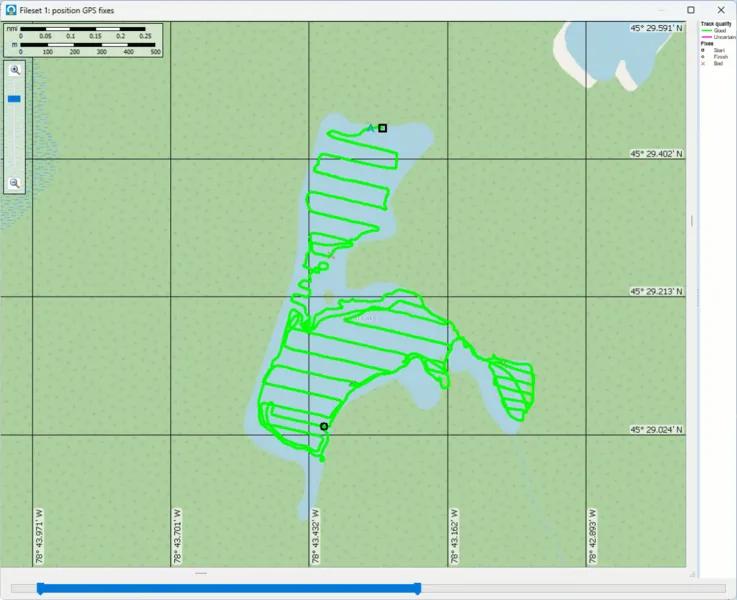
Use preset maps and time sliders to more easily assess the context of your surveys. Data credit: Milne Technologies, Canada.
Interval analysis operators and scatter plots
Time series analysis has been expanded with a range of new tools that enable easier exploration of trends in your data. The addition of Interval Analysis operators allows you to summarize Sv, single target detections, bottom features, or calibration values over defined intervals of pings, time, or distance, giving you a flexible way to understand how your data change over space and time.
New operators are:
- Interval Analysis - Sv, to calculate and graph analysis variables from Sv data over time, including mean Sv, thickness, NASC, ABC, and other metrics.
- Interval Analysis - Single Target, to calculate and graph a range of analysis variables from single target data over time.
- Interval Analysis - Bottom Feature (previously Bottom feature extract), to derive descriptive features from the first and second bottom echoes, which are commonly used for bottom classification purposes.
- Interval Analysis - Calibration, to extract and plot calibration parameters for all pings in an input echogram.
Where applicable, you can quickly graph and review results across time, choose an interpolation algorithm, synchronize and compare calculated metrics directly with echograms, and associate one time series with another for comparisons by way of another new operator, Collate Time Series.
Echoview’s expanded scatter plot features let you plot any time series against another, making it easier to identify relationships or correlations.
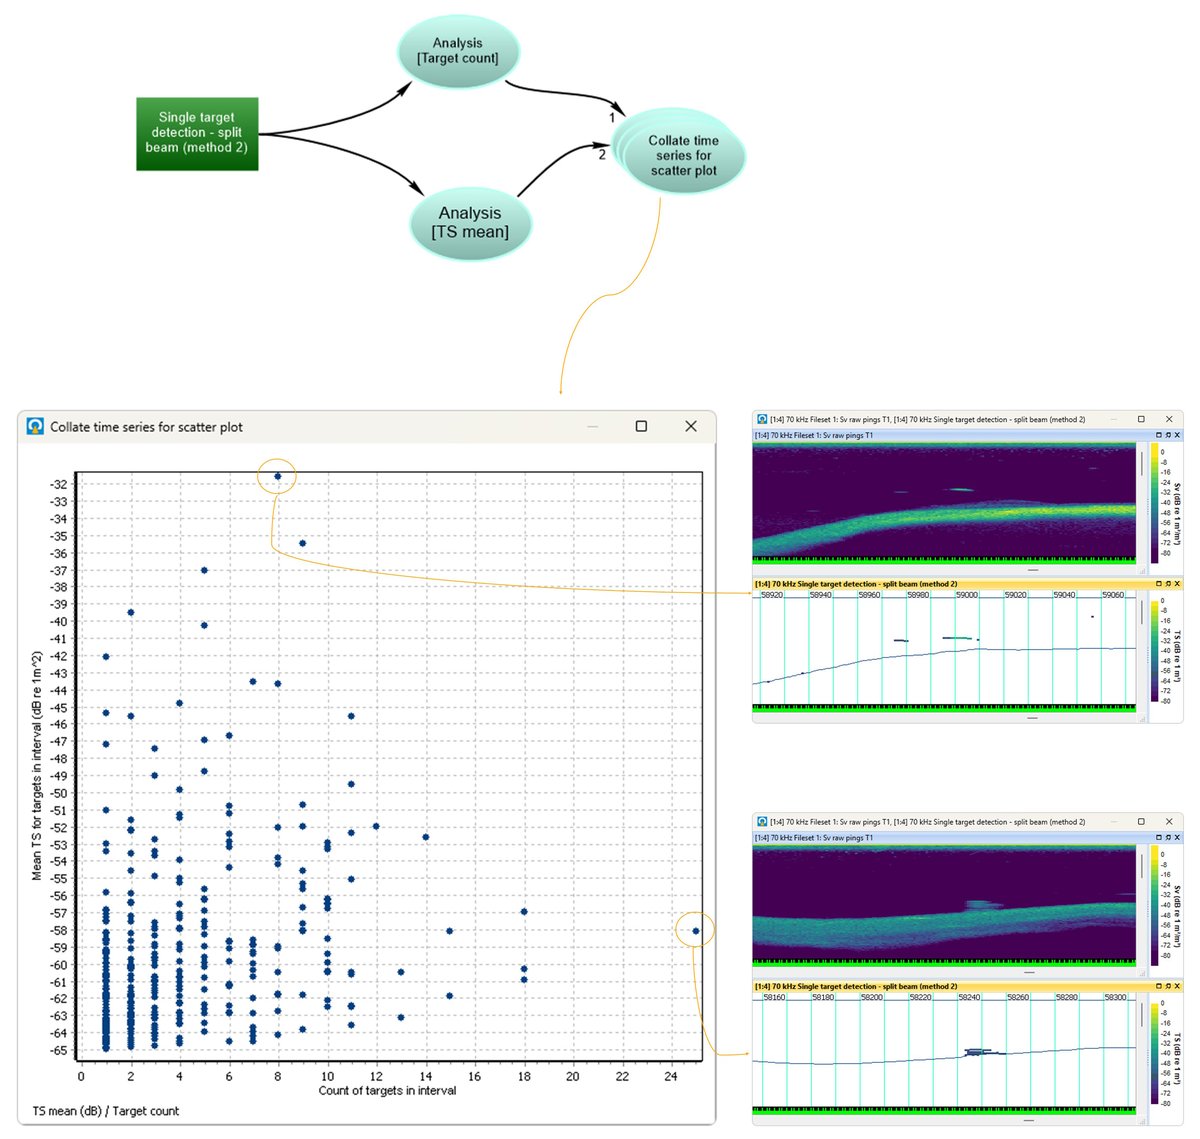
This scatter plot compares target count to mean TS in a single target echogram. You can assess results and easily jump to intervals of interest, such as where there are fewer targets that have a relatively high mean TS (top echogram) or where there are more targets with a lower mean TS (bottom echogram).
Support for loading measurements from CSV files means you can include auxiliary data (for anything from environmental conditions to model outputs) alongside your acoustic data, creating richer analyses and data visualizations.
Exports and analyses
Exporters (first introduced in Echoview 15) have already simplified the way you get results out of Echoview. These tools allow you to preconfigure custom exports and save them in your workflow, enabling you to set up your exports once, reuse them consistently across projects, and be confident that anyone using your EV files is producing results in the same way, saving time and reducing the risk of error. Echoview 16 has further advanced this concept to make exports more versatile and easier to configure and script.
New Exporter features include:
- Additional types of exports are now available as Exporter objects, broadening the range of outputs you can generate. New Exporter objects include echogram exports to *.csv, *.evd, *.hac, MATLAB and image file types; line exports to *.csv, *.evd and *.evl files; and GPS and time series exports to *.csv and *.evd files.
- Full integration into the Dataflow Toolbox, including removal of the prior “Analysis By...” options in the Export menu. Exporters are now created exclusively using the Dataflow Toolbox, making it simple to define and save the exports you require.
- Simplified scripting: instead of configuring multiple parameters in complex COM methods such as ExportEchogramToImageCustom, set them once in an Exporter and then initiate exports with a simpler line of code, such as EvApp.Exec ("ExporterObject | Export | C:\Temp\Demo.jpg")
- Each Exporter’s operator description now lists its required modules.
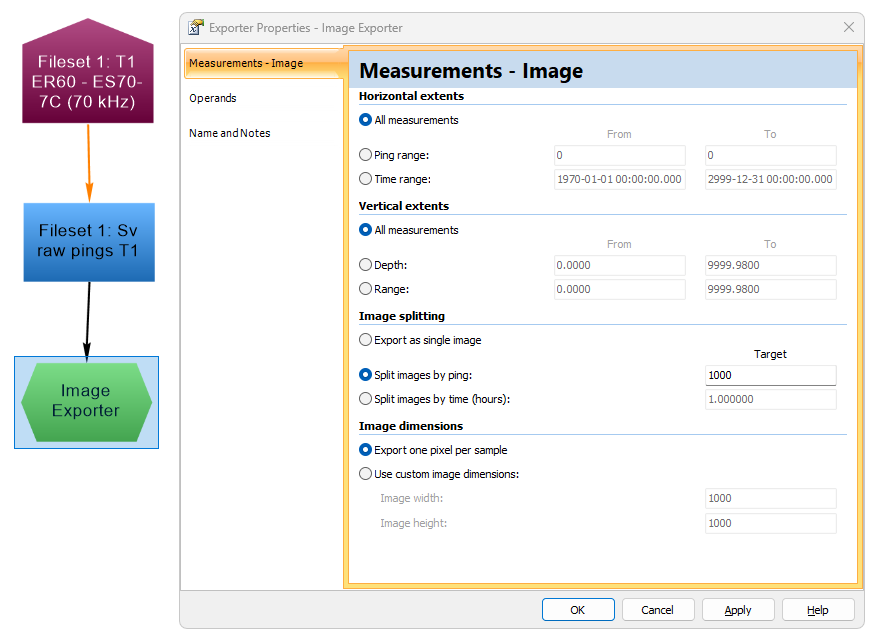
Configuring an exporter to convert echograms into customized image files.
Other export-relevant new features in Echoview 16 include:
- Improved image exports, especially when echograms are split into multiple images.
- Cell-based exports in database mode include Exclude_above_line_depth_mean and Exclude_above_line_range_mean in the *.intervals.csv output file.
- Time series collections can be exported to *.csv files.
New operators
In addition to previously mentioned operators, Echoview 16 adds a variety of new operators to support time series functionality, including Collate Time Series, Time Series Select, and Time Series Set Status.
Existing operators have been updated for time series data, including Copy, Code, Smoothing Filter, and Time Series Range Bitmap.
Other operator updates include:
- Crop Samples, a new operator to remove samples from echograms based on sample index, depth or range.
- The Type Conversion operator now converts data types between linear input operands and output data.
- Code operator access to EK80 filter coefficients and decimation factors, enabling the customization of matched-filter ramping.
- Data thresholds and target filtering properties are no longer automatically inherited from input operands, reducing the risk of errors in data processing workflows.
Interface and usability
The Dataflow window is a core part of data processing in Echoview, and the interactive Dataflow Toolbox is where you create new Dataflow objects. In Echoview 16, it replaces the right-click context menu option used in earlier versions. You can add variables, lines, exporters, scenes and more with a single mouse click, while categories and filters make it easy to locate the tools you need. The Dataflow window is now the central hub for building and refining workflows intuitively, supporting faster project setup and clearer documentation of analysis steps.
The new Multiple Object Properties dialog allows you to bulk-edit almost all properties across multiple variables at the same time, eliminating repetitive clicking and helping to ensure consistency across your data processing workflow.
You can specify a default echogram color scheme in the Configuration dialog (under the File menu), ensuring that every echogram you create uses your preferred colors.
The EV File Properties dialog includes a new Time Series page for defining default display settings. Several existing pages have also been reorganized to make settings easier to find:
- The Lines and Surfaces page has been split into separate Line Pick and Surface Detection pages.
- Projection settings previously on the Mapping page now appear on a dedicated Projection page.
Other features
- The Calibration Assistant requires the “Drop in TS” algorithm to be used when the single target variable does not have angular position information.
- Echocheck support for Kongsberg ME70 and MS70 files.
- Updates to colors or shapes of some Dataflow objects.
- Performance improvements across graphs, tables, and map windows.
- New automation capabilities:
- Improvements to image exports using COM, especially when heave compensation is applied to echogram data.
- The COM method to convert Furuno FSV-30R files to FSV-25 format is renamed from ExportToIcesNetcdf to ExportFSV25.
- Improvements for the handling of date and time when scripting with MATLAB.
- Multibeam school detection settings in EV File Properties can be accessed and modified using the Command Interface.
- Some features are renamed:
- Line Range Bitmap operator is renamed Time Series Range Bitmap.
- Extract Transmission Characteristic operator is renamed to Transmission Time Series Select.
- Extract Bottom Feature operator is renamed to Interval Analysis - Bottom Feature.
- Line Properties dialog is renamed Time Series Properties.
- Some features are removed:
- Delta Sv line pick algorithm.
- All printing functionality.
- Support for Furuno FCV-38 files in V1 format.
Further information
Echoview 16 release notes can be downloaded as a brochure here.
A complete list of features and fixes can be found in the Echoview help file.
System requirements
Echoview 16 is compatible with 64-bit Windows 10 and 11.
Getting Echoview 16
Please contact info@echoview.com to discuss your options for accessing Echoview 16.
Echoview 16 can be downloaded here, or if you have a previous version of Echoview already installed, the new version can be accessed by starting Echoview, going to the Help menu and then clicking Check For Updates.