Echoview 16 is coming soon! Preview new features that will power your hydroacoustic analyses, deliver richer visualizations, and streamline your workflow.
A highlight of the upcoming release is a suite of new Interval Analysis operators that make it simple to calculate, extract, and visualize individual metrics over time.
These operators work by analyzing your input data in intervals (by ping number, distance, or time) and generating a time series of results. You can then graph and compare those results alongside your echograms and cruise tracks for deeper insights.
The new operators coming in Echoview 16 are:
- Interval Analysis – Sv, to calculate and graph analysis variables from Sv data over time, including mean Sv, thickness, NASC and ABC, and other ’echometrics’.
- Interval Analysis – Single Target, to calculate and graph a range of analysis variables from single target data over time.
- Interval Analysis – Bottom Feature (previously Bottom feature extract), to derive descriptive features from the first and second bottom echoes, which are commonly used for bottom classification purposes.
- Interval Analysis – Calibration, to extract and plot calibration parameters for all pings in an input echogram.
Interval analyses are ideal for detecting patterns, monitoring changes, and comparing with other time series. In Echoview, you can:
- Quickly graph and review results across time.
- Synchronize and compare calculated metrics directly with echograms.
- Associate one time series with another to create scatter graph comparisons by way of another new operator in Echoview 16, Collate Time Series.
Our recent sneak peek on bubble plots used the Interval Analysis – Sv operator to calculate the time series used in the Sv mean and proportion occupied maps.
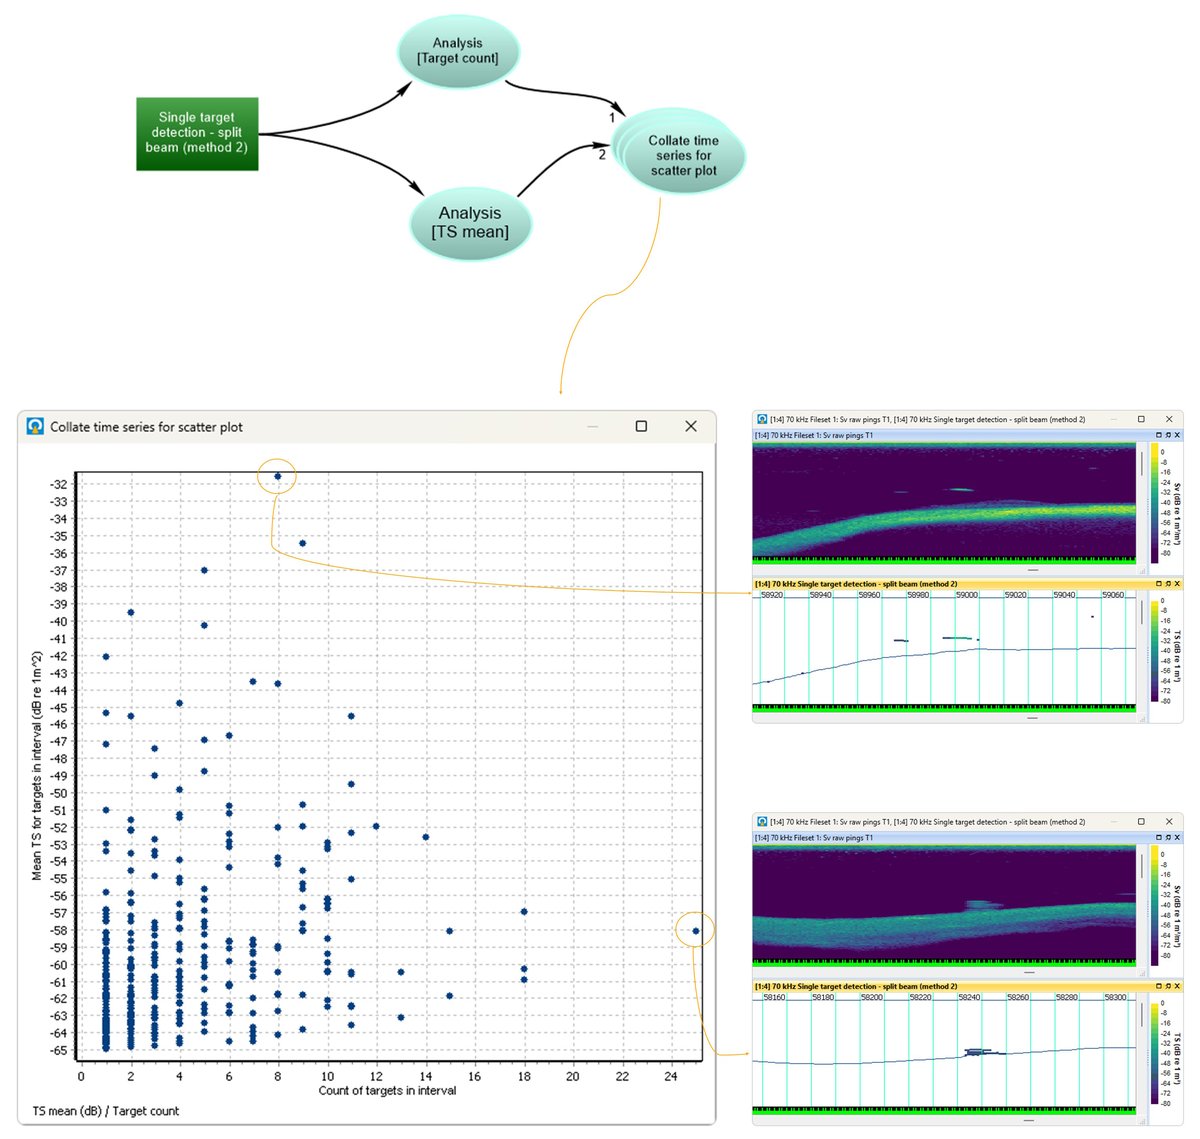
In the image above, a scatter plot compares target count vs mean TS in a single target echogram. This interactive view lets you assess the results and easily jump to intervals of interest, such as where there are fewer targets that have a relatively high mean TS (top echogram) or where there are more targets with a lower mean TS (bottom echogram). The graph was generated using the new Interval Analysis – Single Target and Collate Time Series operators.
Echoview 16 will be available for beta testing in the coming weeks, and will be officially released later in 2025.
Did you see our previous sneak peek?
To be notified when new releases are available, please join our mailing list.