
We are thrilled to unveil the beta release of Echoview 16
Visual. Dynamic. Precise.
We’re excited to announce that Echoview 16 beta is now available! This release delivers exciting new features to help you get even more from your hydroacoustic data. Developed with the support of our expert team of scientists, programmers, and quality assurance specialists, these updates represent our continued commitment to delivering high-quality data processing solutions.
Here is your chance to explore these enhancements early and put our beta release to the test. As with all beta releases, this version is intended for testing only. We’d love your feedback on usability, functionality, or any issues you encounter at support@echoview.com. We advise against using it for critical data processing tasks due to the slight possibility of functionality or calculation errors.
The Echoview 16 beta release can be reviewed by anyone with licensed access to Echoview 15, and the official release will be available to users who have an active MATS plan. To check the status of your license, please reach out to info@echoview.com.
Read on for an overview of what you can look forward to in Echoview 16, and start testing these new capabilities today!
Exports and analyses
- Calculate wideband echointegration analysis variables (ABC_f, NASC_f, and Sv_f_mean) for Kongsberg EK80 data
- Include a source variable name in EVD exports
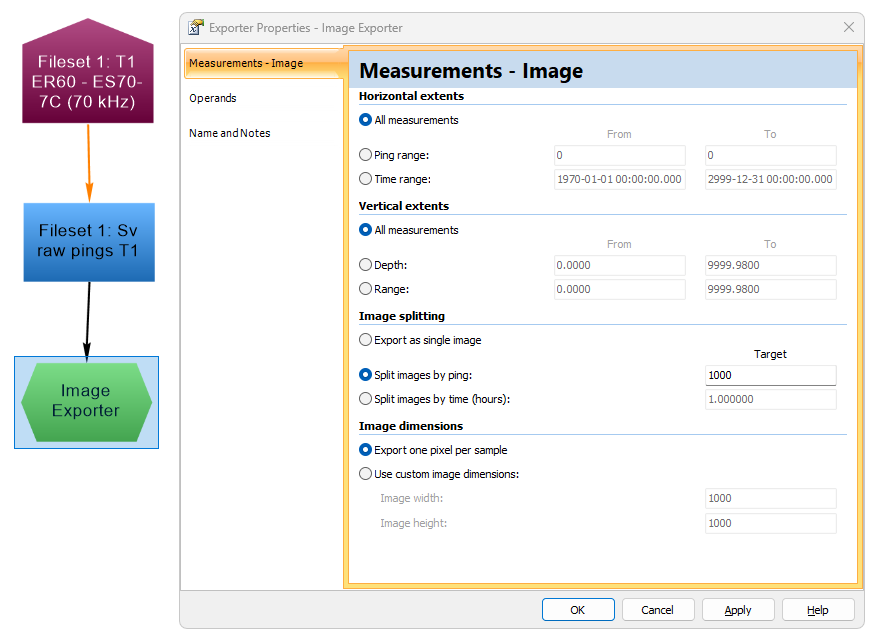
- Add new Exporters to your workflow to preconfigure exports for echograms, GPS data, lines, and other time series. Output formats include CSV, EVD, EVL, HAC, MATLAB, and image formats (where applicable)
- Create and use Exporters for all analysis-type exports, which replace the Export menu options for “Analysis By…”
Read more about the Exporter changes in our sneak peek here.
Dataflow Toolbox
- Use the Toolbox as your hub to create new variables and other objects in the Dataflow window, such as virtual variables, lines, and exporters
- Leverage built-in categories and filters to easily find the item of interest in the Toolbox list
Cruise tracks and other maps
- Enjoy high-quality, fast-to-load Web Map Tile Service (WMTS) backgrounds in cruise tracks and other map windows, with options to specify your own map servers.
Read more about maps in the sneak peek here.
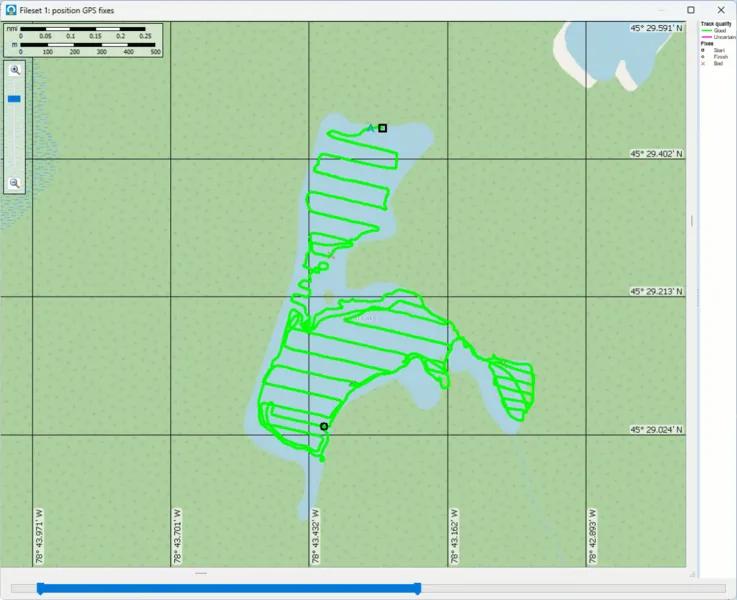
- Take advantage of time sliders in cruise track windows to help you focus on specific survey segments – particularly useful for overlapping transects
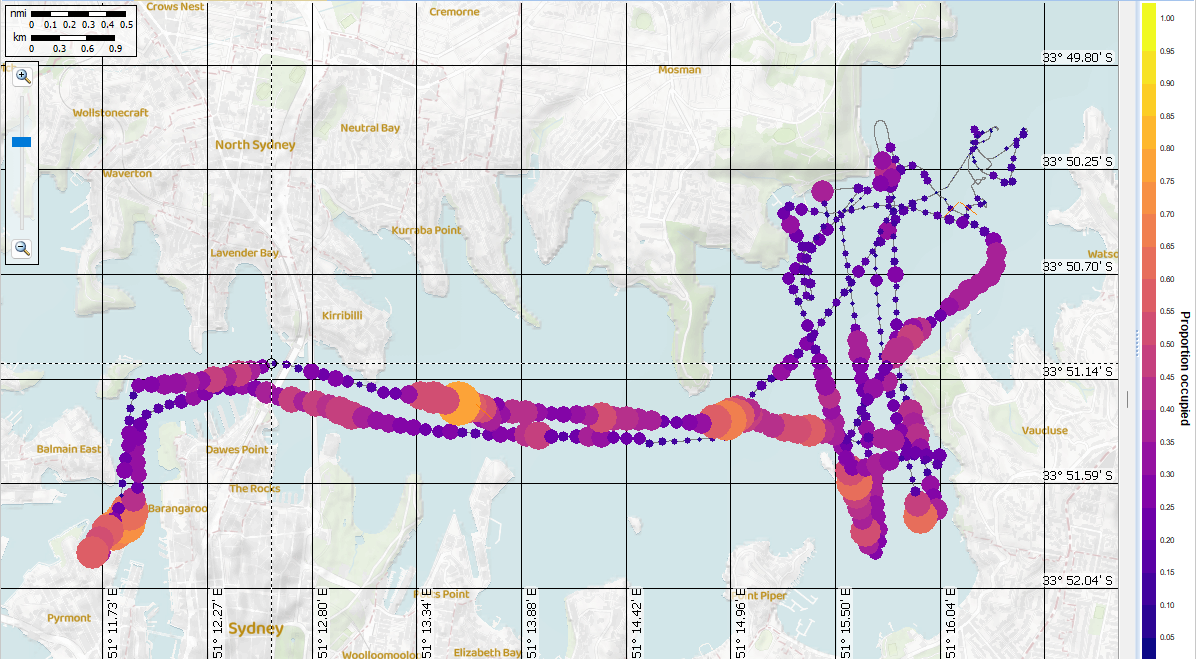
- Create bubble plots for spatial visualization of key data metrics: identify trends and outliers or produce clear, presentation-ready graphics
Time series
- Create, explore, analyze, and visualize existing and new types of time series data using:
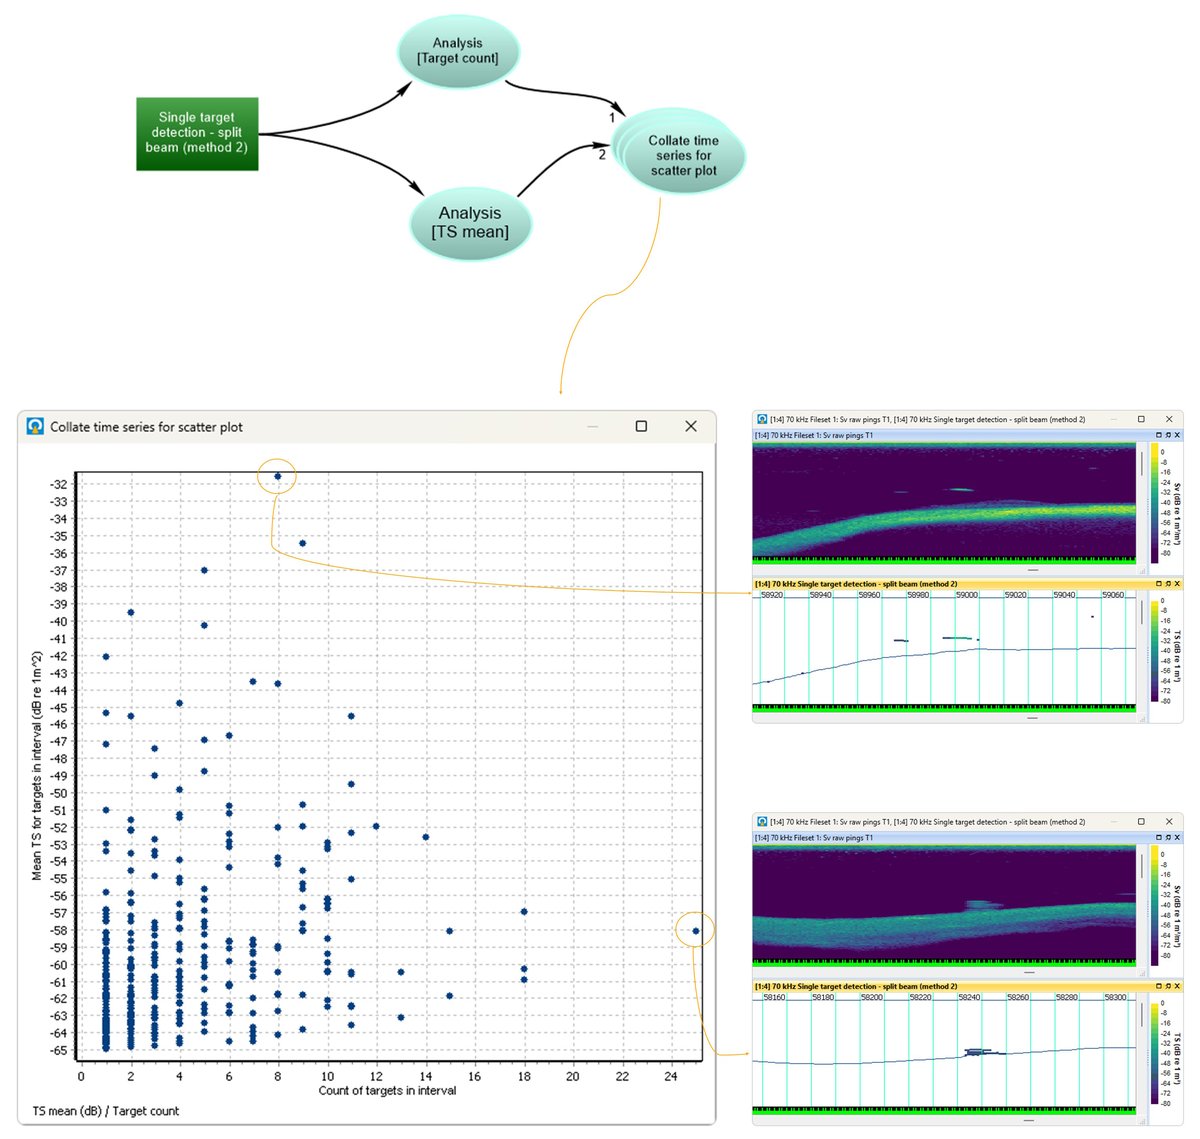
- Interval Analysis operators, to summarize Sv, single target, bottom feature, and calibration data by ping, distance, or time, producing results that can be graphed, tabulated, compared with other series, or mapped
- Scatter plots to graph one time series against another and explore data relationships quickly
- Custom time series data added via *.table.csv files, enabling comparisons and filtering based on any measurement you like
- New and updated time-series-compatible operators: Time Series Set Status, Time Series Select, Time Series Range Bitmap, Collate Time Series, Code, Smoothing Filter, and more
Operators
- Make use of other new and updated operators, including:
- Crop Samples, to remove samples outside of defined boundaries
- Type Conversion support for linear data types
See the sneak peek for Interval analysis and scatter plots here.
Data and file formats
- Enjoy new and updated support for several echosounders and sonars:
- Humminbird fish finders, including 900/1100 series, Helix, Solix, and Apex models
- Pulse duration in Lowrance*.sl3 sonar log files
- Sound speed profile corrections for Nortek data
- Convert single beam data to ICES SONAR-netCDF4 *.nc files
Read more about data and file formats in the the sneak peek here.
Interface
- Use the Multiple Object Properties dialog to easily change properties across multiple variables at once, with access to every property associated with any object
- Set a default echogram color scheme option in the Configuration dialog box
- See improved performance and responsiveness in graph, table, and map windows
Feedback
There’s much more to explore in this release so be sure to read the Help file installed alongside Echoview 16 to browse a comprehensive list of all new features.
If you test these updates, we’d love to hear your feedback, please send any comments or questions to support@echoview.com.
Download Echoview 16 beta
Echoview 16 beta can be downloaded from the Latest version of Echoview page.