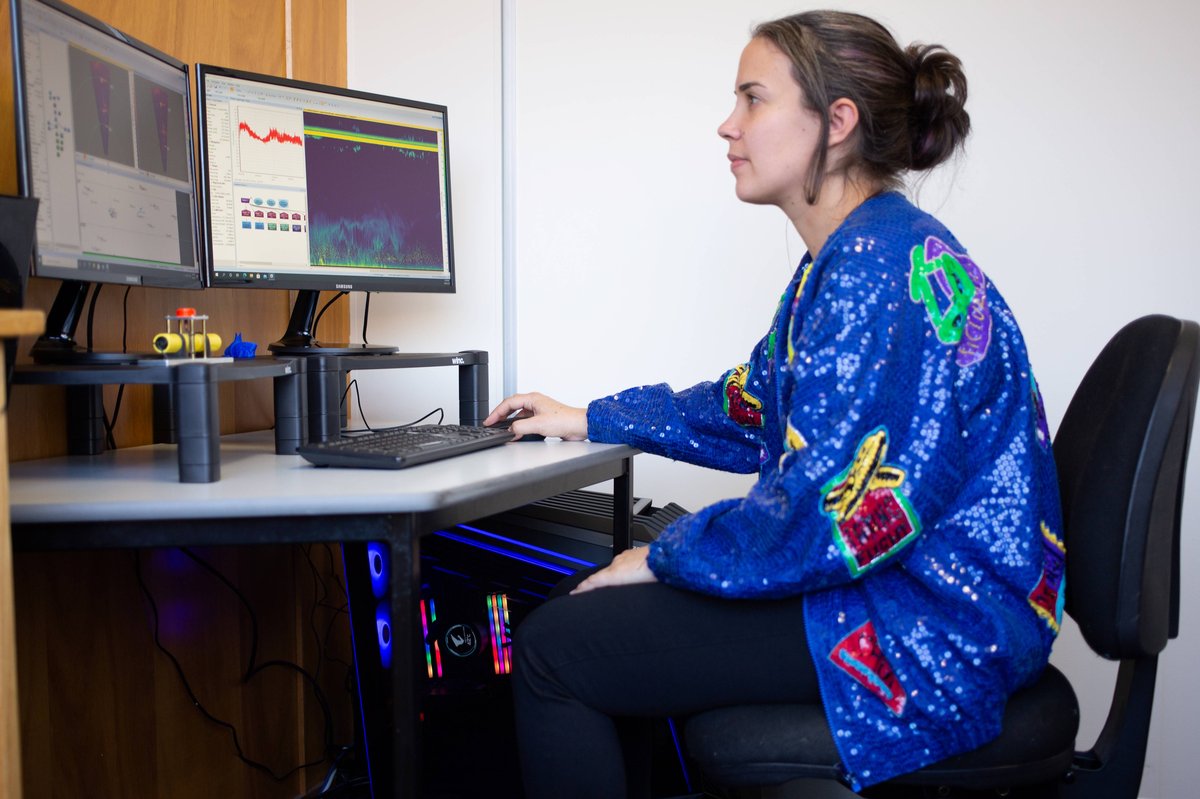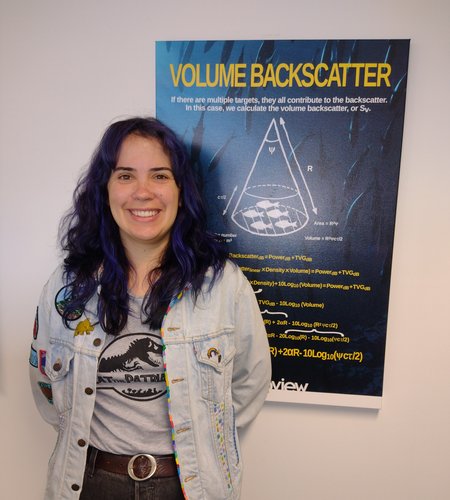
Meet Echoview Acoustician, Dr Haley Viehman
Haley has been with Echoview Software for over four years in the role of Acoustician. She is a key member of our science team, supporting our customers globally with their hydroacoustic needs.
Haley was recently the lead author on the paper “The Ups and Downs of Using Active Acoustic Technologies to Study Fish at Tidal Energy Sites” published here. The paper was developed in conjunction with the Fundy Ocean Research Center for Energy (FORCE), based in Nova Scotia, Canada.
The paper investigates using active acoustic (hydroacoustic) technology for studying fish at sites targeted for tidal energy development. As tidal energy is a nascent industry, it is important to research the effects of tidal energy devices on fish. This requires understanding how the sensing technology used can be influenced by the environment under study. Echoview was used for the data processing in this work.
We caught up with Haley to find out more about her research and the outcomes.
What was the aim of the research?
Tidal energy is one new form of renewable energy that allows us to generate electricity from fast tidal currents. The devices that do this vary in form, but generally involve a large underwater turbine (or several smaller ones), either free-standing on the seafloor or floating at the surface and moored to the bottom. The sustainability of this renewable energy technology depends on how it affects its environment. Fish are a key component of the marine environment, but the effects of these devices on fish remain uncertain. This is mainly because relatively few devices have been installed to date, and rarely alongside sufficient data collection to draw conclusions about interactions with fish.
So, we have been trying to collect as much information as we can on fish at the sites targeted for tidal energy development, in order to understand how likely fish are to interact with a given device (and therefore potentially be affected by it).
Hydroacoustics is one of the best tools for observing fish in these environments: the fast currents and complex bathymetry at these powerful sites usually mean physical sampling methods, such as trawls, are ineffective at sampling the fish community, or too dangerous to those fishing them.
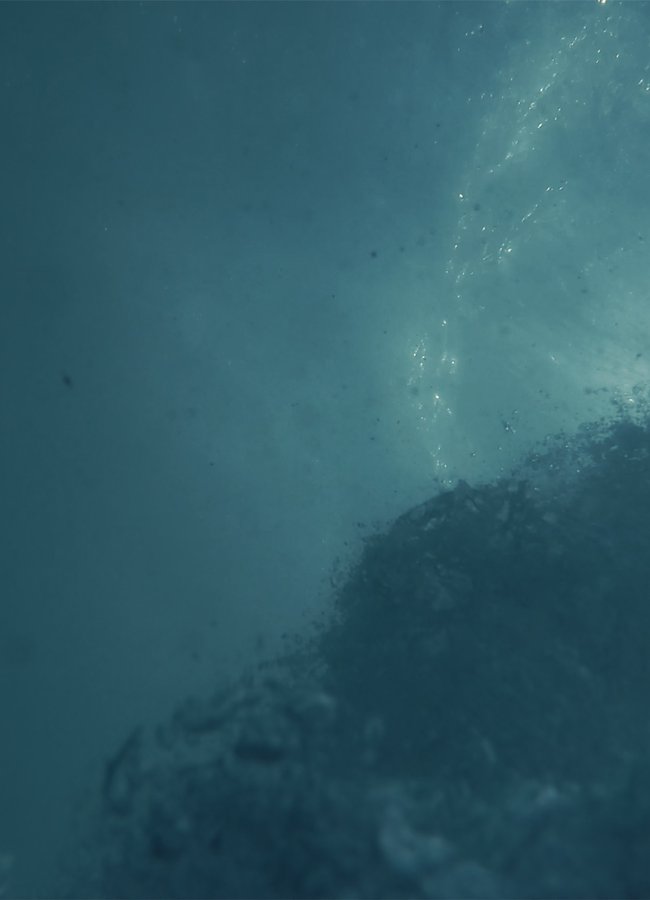
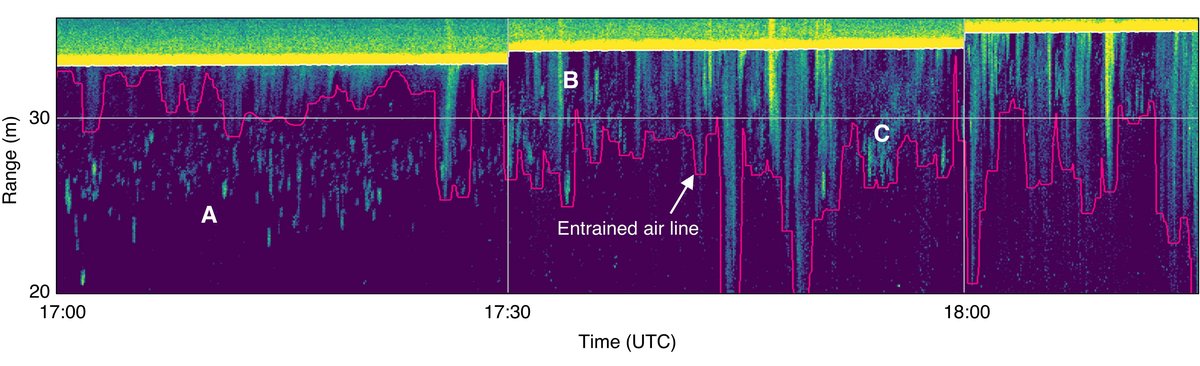
Like any other data collection tool, hydroacoustics comes with limitations. The main issue at these sites is the large quantities of air bubbles that are dragged down into the water column by the strong, turbulent currents. Bubbles strongly reflect underwater sound, so clouds of bubbles are basically opaque to the echosounders we use. This means we can’t say anything about the fish in the parts of the water column that contain a lot of air bubbles.
Entrained air bubbles are a big challenge for most hydroacoustics users at tidal energy sites, but we hadn’t previously specifically examined the data loss caused by bubbles and how that loss might influence our conclusions about the potential interactions of fish with tidal energy devices. That’s why we wrote this paper.
Where did your data come from?
FORCE collected the hydroacoustic data using a Simrad EK80 WBAT echosounder mounted on FORCE’s remote subsea platform (the Fundy Advanced Sensor Technology, or FAST, platform) and set to record data every half hour.
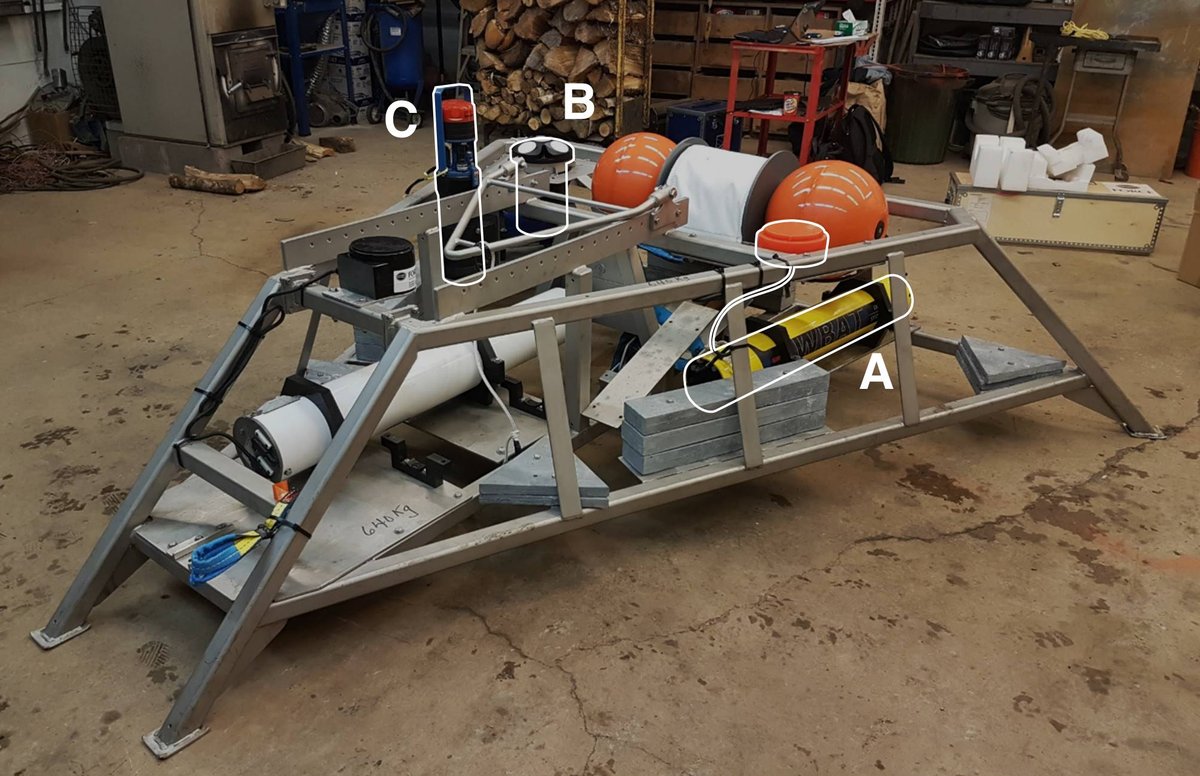
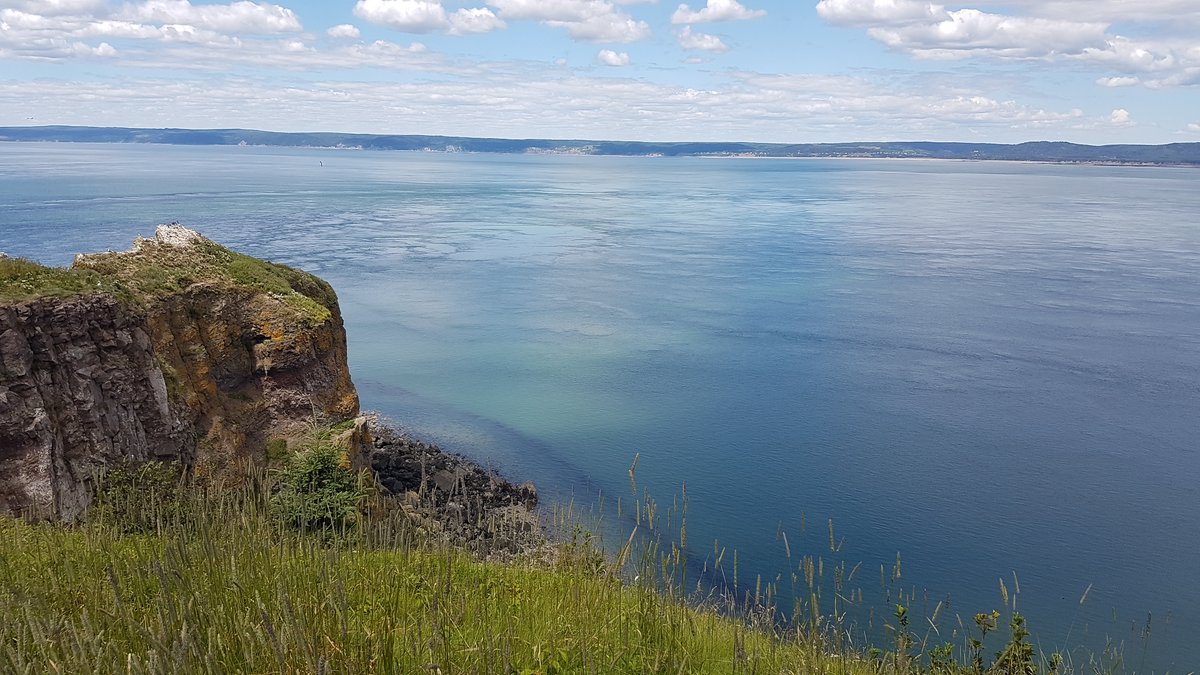
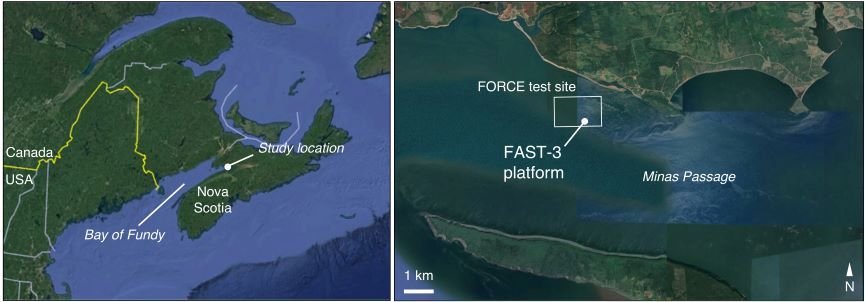
We gathered environmental data with other instruments on the platform, including a Nortek Signature 500 ADCP, which provided current velocity throughout the water column, and an Aanderaa SeaGuard RCM, which provided water temperature and salinity measurements. The platform was deployed on the seafloor in the FORCE tidal energy test site, in the Minas Passage of the Bay of Fundy in Canada, which has the highest tides in the world and some of the fastest tidal currents (up to 5 meters per second, or 10 knots).
We processed 53 days of hydroacoustic and environmental data. To do this, we created an Echoview template that reliably detected the depth of the entrained air layer, and used automation scripts in R to apply that template to all the data files and run the necessary exports. This approach minimized the amount of time we needed to spend on manual data processing and corrections (we provided our template with the paper, if you’d like to see how this was done).
What are the key findings?
We found that entrained air contaminated much of the data, as expected (about 30% overall), but that the contamination was not spread out evenly over time or depth. The upper portion of the water column was almost always hidden from us by entrained air. But at current speeds under 3 m/s (about 80% of the time), most of the water column (the lowermost 70%) was generally still useable. Periods of neap tides had the cleanest data, as current speeds rarely exceeded 3 m/s, and periods of spring tides had the greatest data loss.
This tells us a lot in terms of when sampling will be the most effective (e.g. near neap tides), and where gaps in our knowledge can be expected (faster current speeds, in the upper water column). This information can help us design more efficient studies, and to incorporate complementary sensing technologies that minimize knowledge gaps.
Results of the simulations we ran also emphasized the point that patterns in data loss may matter as much as (or more than) the amount of data loss. These patterns (missing more of the upper water column as tidal current speed increases) can interact with underlying patterns in fish distribution (such as daily or tide-related movements up and down) to generate false pictures of what is occurring. Researchers of tidal energy sites must therefore be careful to interpret results from hydroacoustic data with this problem in mind, to avoid drawing false conclusions about when fish are present in different parts of the water column. We additionally should be very careful when extrapolating any findings from slower current speeds (which are easier to sample) to faster ones (which won’t be sampled as well) until we have a better understanding of how behavior of the different fish species may be influenced by current speed.
To address the concerns of regulators and the public about the effects of tidal energy devices on fish, and to support the sustainable development of this renewable energy industry, we need to understand the advantages and considerations of hydroacoustics as a tool in these unique environments, and to consider how the strengths of different technologies may be combined to form a more complete picture of the potential interactions of fish with tidal energy devices.
Thank you for your time, Haley!