Client
Dr. Serdar Sakinan and Dr. Ali Cemal Gücü - Middle East Technical University in Turkey
“Echoview and in particular the variety of tools that its Advanced Operators module offers, turned the complex processing sequences into, fast, simple and easy to handle steps.”
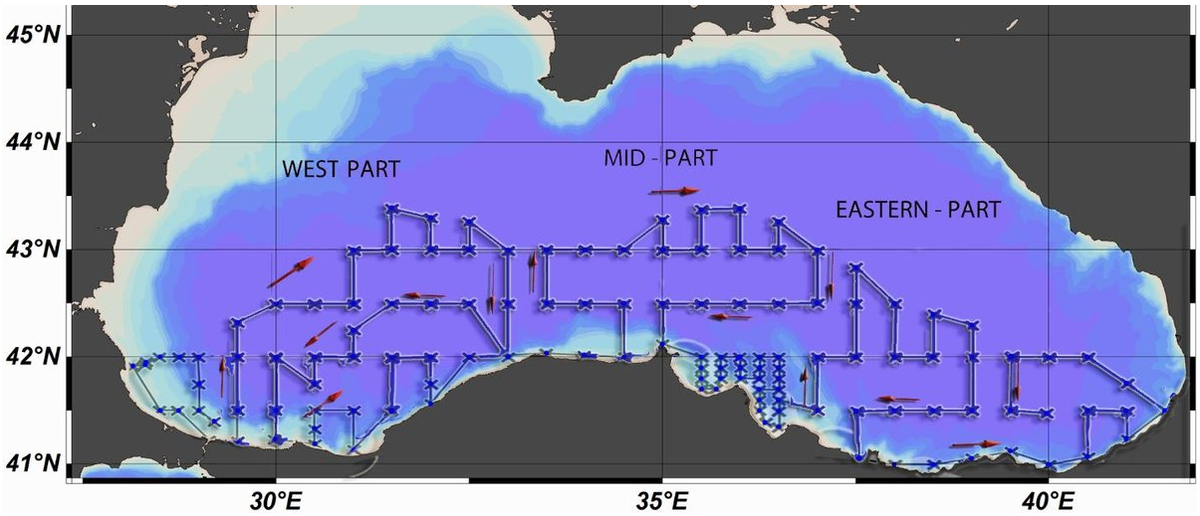
Sampling stations and acoustic transects in the Black Sea in July 2013 (Image courtesy Dr. Sakinan)
Background
Automated species identification via the classification of backscatter measurements from echosounders and sonars “remains the ‘Holy Grail’ to acoustic researchers” (Horne 2000). The lack of physical samples is a well-known shortcoming of acoustic data and presents researchers with a data-processing challenge.
Fisheries research in the Black Sea
At the Middle East Technical University in Turkey, Echoview users Dr. Serdar Sakinan and Dr. Ali Cemal Gücü investigated the ecology of the copepod Calanus euxinus in the Black Sea, which is prey for important commercial fish species such as sprat (Clupeonella cultriventris) and anchovy (Engraulis encrasicolus).

Multifrequency analysis to identify different groups of organisms
Sakinan and Gücü used a combination of two different multifrequency classification techniques in Echoview to separate copepods from other organisms in their echosounder data. These techniques involved:
- Summing the backscatter of samples across frequencies (ΣSv) and filtering into different groups based on their magnitude (after Ballón et al. 2011)
- Subtracting the backscatter of samples across frequencies (ΔSv) and filtering into different groups based on their distance (Z) from species-specific ΔSv distributions (after De Robertis et al. 2010)
These techniques allowed the researchers to discriminate copepods from fish, enabling them to examine their distribution in relation to environmental factors such as oxygen concentration and temperature.
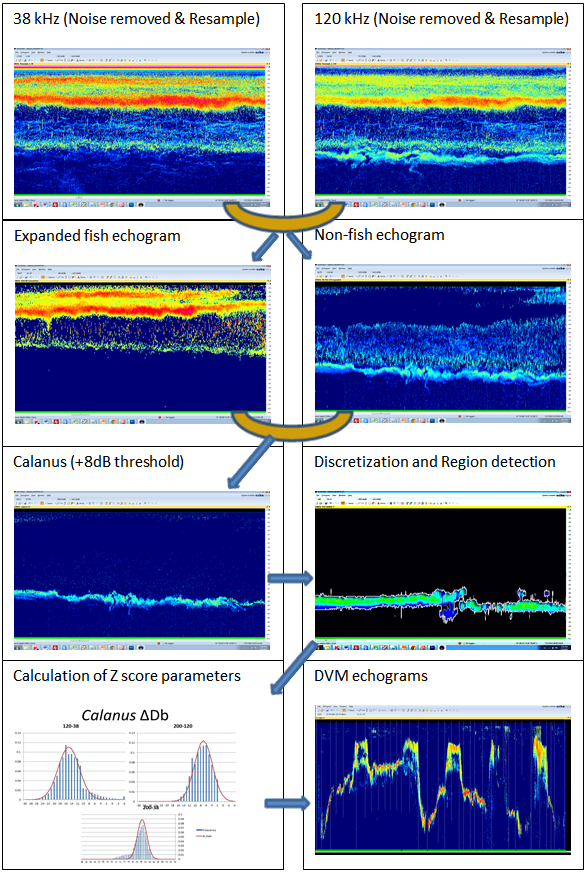
The flowchart used to extract Calanus copepod layers (Image courtesy Dr. Sakinan)
For more information
Echoview provides a wide range of tools for the visualization, processing and analysis of data from echosounders and sonars. To find out how you can use Echoview for your acoustic data, please contact the Echoview team.
Acknowledgements
Echoview wishes to thank Dr. Serdar Sakinan and Dr. Ali Cemal Gücü of the Middle East Technical University in Turkey for permission to present their work.
References
- Ballón, M., Bertrand, A., Lebourges-Dhaussy, A., Gutiérrez, M., Ayón, P., Grados, D. and Gerlotto, F. 2011. Is there enough zooplankton to feed forage fish populations off Peru? An acoustic (positive) answer. Progress in Oceanography 91:360-381.
- De Robertis, A., McKelvey, D. R., and Ressler, P. H. 2010. Development and application of an empirical multifrequency method for backscatter classification. Canadian Journal of Fisheries and Aquatic Sciences 67:1459-1474.
- Horne, J.K. 2000. Acoustic approaches to remote species identification: a review. Fisheries Oceanography 9-4: 356-371.